How does it work?
- You build and deploy your application.
- You write a JMeter test plan to exercise your application.
- From Ant, you run the JMeter test plan and log the results, using the Ant JMeter task.
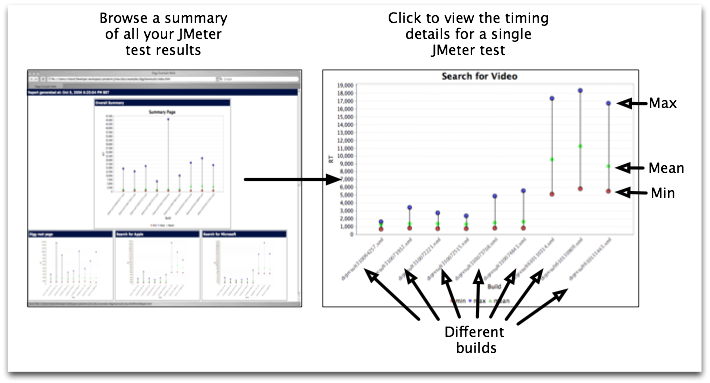
- JChav reads all the JMeter logs from each of your runs (one per build), and produces a set of charts for each test in each run.
- Each time you deploy, re-run the JMeter tests and the JChav tool to update the charts to show the change in performance.
Getting started
JChav is made available under the Apache 2.0 license.
- Take a look at our quick start guide.
- View the detailed configuration examples.
- Browse the source and contrubte at Google Code.
Live Demo
If you would like to see what the reports look like we have a live demo of the site available here. It shows a series of threads accessing the www.digg.com site. The example section below shows the scripts used to produce these results.
1 comment:
really cool tool, I will have a look on it.
I have a question regarding to the blog, how do you post xml????
Thanks
Emerson
Post a Comment