Friday, July 10, 2009

JChav 1.1.2 Released

These changes have been released as part of JChav 1.1.2:
  • Fixed issue 20: support for sample and httpSample output from JMeter.
  • Fixed issue 23: support for <fileset> in the JChav Ant task.
  • Fixed issue 24: improved CSS to avoid image cropping (thank you paul.blizzard).
  • Findbugs warnings fixed.
  • log4j configuration included.
  • Tested with JMeter 2.3.4
Download: jchav-1.1.2.zip and check out the quick start guide. As a consequence of adding support for Ant's fileset, we have deprecated the "srcdir" attribute in the JChav ant task. You can migrate your Ant scripts by replacing...
<jchav srcdir="SOME_DIR" ... />
with....
   <jchav ... >
     <fileset dir="SOME_DIR" includes="**/*.xml" />
   </jchav>

Saturday, December 22, 2007

JChav 1.1.1 Released

JChav 1.1.1 is now available, and includes the following changes:
  • Fixed the Digg example JMeter script by adding a User-Agent header.
  • We can now read the HTTP status code from JMeter results, although how we use this value to show error status codes is up for discussion.
  • Fix for issue 18 and 22: the length of the filenames created by JChav could cause a problem for some operating systems. The filesnames are now MD5 hashes, which should resolve this issue.
  • Documentation enhancements.
  • Tested with JMeter 2.2 and 2.3.1 under JDK 1.5
Download: jchav-1.1.1.zip.

Friday, May 25, 2007

Google London Open Source Jam

Here are the slides from the presentation we did on JChav at the Google Open Source Jam in London on 24 May 2007: jam-london-2007.pdf. I'm not sure how much sense they'll make by themselves, but perhaps some one will find them useful.

During JChav presentation

Photo by adewale_oshineye

Friday, October 20, 2006

JChav 1.1.0 Released

JChav 1.1.0 is now available, featuring:
  • The y-axis (response time) is now uniform across all charts by default. This means when you look at the summary page you're comparing like with like. This option can be controlled by the Ant option of uniformyaxis="true|false".
  • Bug fix: the max value for some tests was not set if the first value in the results was both the min and max values. This showed up as a chart with a huge y-axis scale.
  • Minor chart changes: the thumbnail graphs now do not show the (unreadable) x-axis labels, saving a bit of screen space.
  • A Maven 2 plugin has been contributed (thanks to Tim McCune for this). You will also want to check out his JMeter Maven plugin.
We're not (yet) regular Maven users, so apologies if we've messed it all up and undone Tim's good work. The instructions that seem to work for us: download the 1.1.0 ZIP release; cd into the etc folder; run mvn -f maven-jchav-plugin-pom.xml install.

Download: jchav-1.1.0.zip

Friday, October 06, 2006

About JChav

JChav is a way to see the change in performance of your web application over time, by running a benchmark test for each build you produce.

Example of the JChav reports output.

How does it work?

  • You build and deploy your application.
  • You write a JMeter test plan to exercise your application.
  • From Ant, you run the JMeter test plan and log the results, using the Ant JMeter task.
  • JChav reads all the JMeter logs from each of your runs (one per build), and produces a set of charts for each test in each run.
  • Each time you deploy, re-run the JMeter tests and the JChav tool to update the charts to show the change in performance.
By running this often you can see the effect of code change on your application performance.

Getting started

JChav is made available under the Apache 2.0 license.

Live Demo

If you would like to see what the reports look like we have a live demo of the site available here. It shows a series of threads accessing the www.digg.com site. The example section below shows the scripts used to produce these results.

Thursday, October 05, 2006

Download & Quick Start

  • JChav needs Java 1.5 (or later), which can be downloaded from java.com.

  • Download and install Apache Ant.

  • Download and install JMeter.
  • If you've not used Ant or JMeter before, check out the detailed example we provide.

  • Download and extract the latest release of JChav: from the Google Code site.

  • Read on to configure JChav and run against your own site. However, if you'd like to run the example we supply, which runs a few tests against the Digg.com web site, to can: in the docs/examples directory of JChav, edit the two lines in build.properties to let JChav know where it's installed and where to find Jmeter. Then, from the docs/exampes directory, run ant -f build-example.xml. It'll take a while to run as it samples the Digg.com web site. When it's over open digjchavresults/index.html in your web browser.

  • Modify or create an Ant build file to run your JMeter test and record the results. Also set up the location of JMeter, where you'd like the results to be written, etc. Here's an example, which you can use by modifying the value of various properties:
  •  <target name="init">
      <!-- Produce a build id. If using a continuous build 
              process inherit the build. id from that" -->
      <tstamp>
       <format property="build.id" pattern="dMMhhmmss" locale="en"/>
      </tstamp>
    
      <property description="The location of the install of JMeter" 
       name="jmeter.install.dir" value="DIRECTORY_TO/jakarta-jmeter-2.2" />
    
      <property description="The directory containing the jchav jars" 
       name="jchav.libs.dir" value="DIRECTORY_TO/jchav" />
     
      <property description="The JMeter test plan script we want to run" 
       name="jmeter.testplan" value="YOUR_PLAN.jmx" />
    
      <property description="The location to store the per run files" 
       name="jmeter.result.dir" value="jmeter-results" />
    
      <property description="The resulting file location, make sure this is unique for each build" 
       name="jmeter.result.file" value="${jmeter.result.dir}/result-${build.id}.xml" />
    
      <property description="The location to generate the html and charts to. " 
       name="jchav.result.dir" value="jchav-results" />
     </target>
       
     <target name="run-jmeter" depends="init"
       description="Execute the JMeter test plan, recording the results to a file.">  
    
      <taskdef name="jmeter"
             classpath="${jmeter.install.dir}/extras/ant-jmeter.jar"
             classname="org.programmerplanet.ant.taskdefs.jmeter.JMeterTask"/>
    
      <jmeter   
             jmeterhome="${jmeter.install.dir}"
             testplan="${jmeter.testplan}"
             resultlog="${jmeter.result.file}">
                 <property name="jmeter.save.saveservice.output_format" value="xml"/>
      </jmeter>
     </target>
    
  • Run your ant task to gather statistics: ant run-jmeter. Based on the simple example about you'll end up with an XML file in the output directory of jmeter-results.

  • Modify your Ant build file to run JChav on the JMeter results. Here's an example:
  • <target name="run-jchav" depends="init"
       description="Produce JChav report from the JMeter results">
      
       <taskdef name="jchav" classname="com.googlecode.jchav.ant.JChavTask">
          <classpath>
             <fileset dir="${jchav.libs.dir}/">
                <include name="**/*.jar"/>
             </fileset>
          </classpath>
       </taskdef>
      
      <jchav srcdir="${jmeter.result.dir}" destdir="${jchav.result.dir}"/>
    </target>
    
  • Run the ant task, e.g., ant jchav. This will create an output directory such as chav-results. Open index.html to see your reports.

  • Problems? Issues? Fixes? Suggestions? Post them on the project issue tracker.
Thanks for trying JChav.

Wednesday, October 04, 2006

Continuous Performance Monitoring With JChav

We think you will get the most benefit from using JChav alongside a continuous integration tool like CruiseControl or Continuum. 
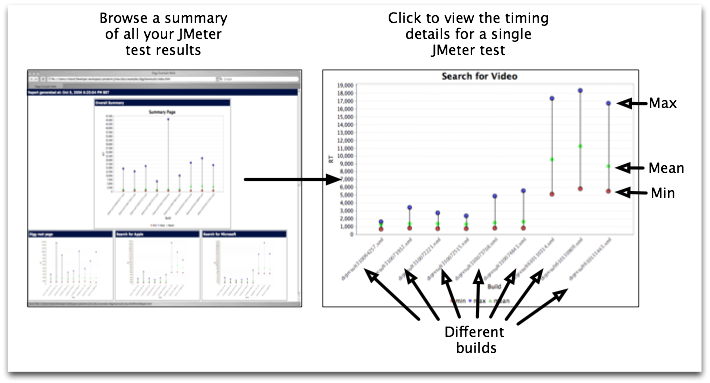
By integrating JChav into the automated build/test/deploy cycle you get the additional benefit of being able to see if the changes made are having a positive or negative effect on performance. Those changes are immediately available to all interested parties. The typical build arrangement in ant/cruisecontrol we use is as follows : 
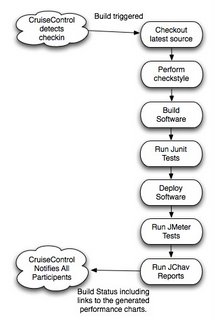
So as soon as a developer commits a change to the source code repository an automated build is triggered. The normal ant build is run including any checkstyle constraints, JUnit tests etc. The build also deploys the application before triggering the JMeter scripts and performance chart generation through JChav. The notification via email to all the build participants contains a link to the generated charts. Bringing performance monitoring into every cycle in a simple way stops any nasty suprises at a later date. Trying to add performance testing to a large establish application looks unsurmountable, but ... one test at a time, seeing the graph going the right way will help to motivate you to adding more.